
bonguynvan
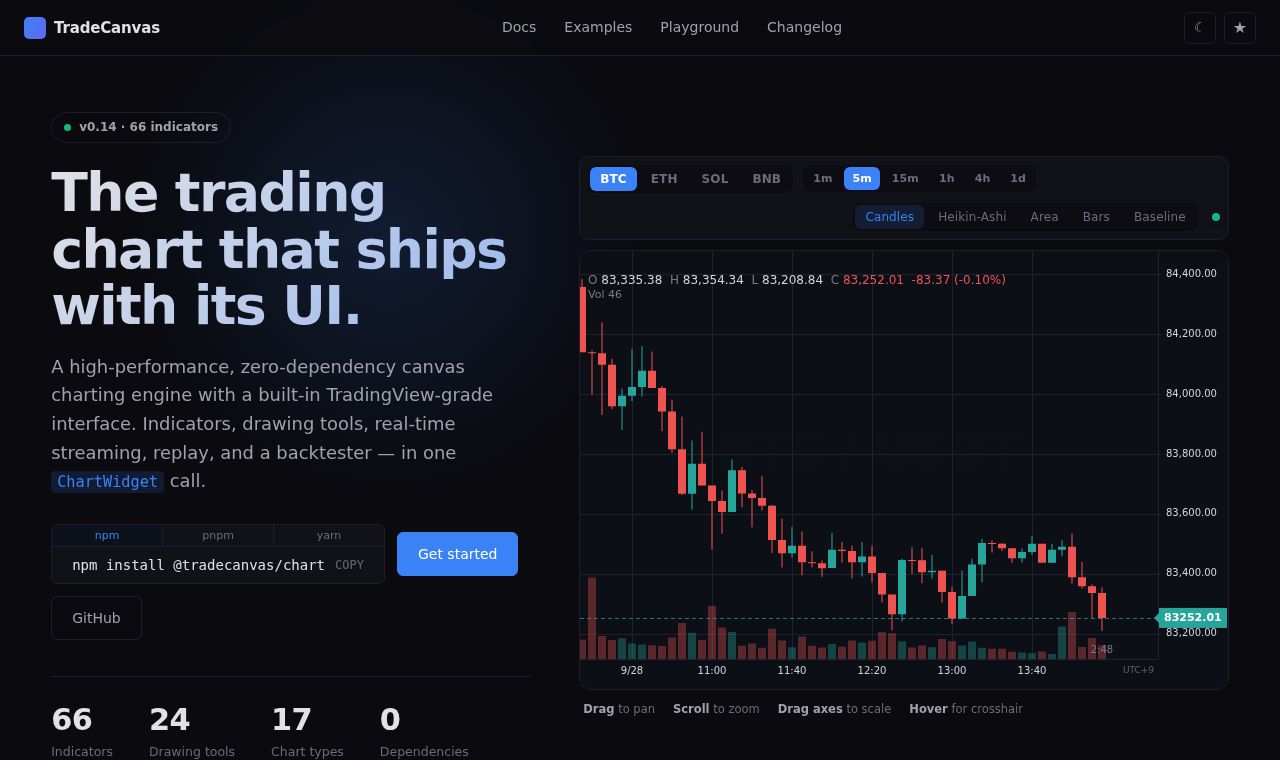
A web chart library combining trading, analysis and historical replay in a single chart.
 SITE CAPTURE
Based on information published on the service's website. Selection and review policy
WHAT IT DOES
What does it do?
TradeCanvas is a chart library for web trading apps. It provides a complete widget and a headless engine for building a custom UI. Users can drag orders and stop loss and take profit prices on the chart, then replay historical prices to see how indicators and simulated orders change. It supports React, Vue, Svelte and plain TypeScript.
KEY FEATURES
Key features
- Render trading charts with Canvas 2D or WebGL
- Provide 111 indicators and 69 drawing tools
- Adjust orders and stop loss and take profit prices on the chart
- Replay historical data bar by bar for simulated trading
- Integrate as a complete widget or headless engine