Sheet Insights BI
An analytics tool that turns Excel and CSV files into dashboards without sending them off your device
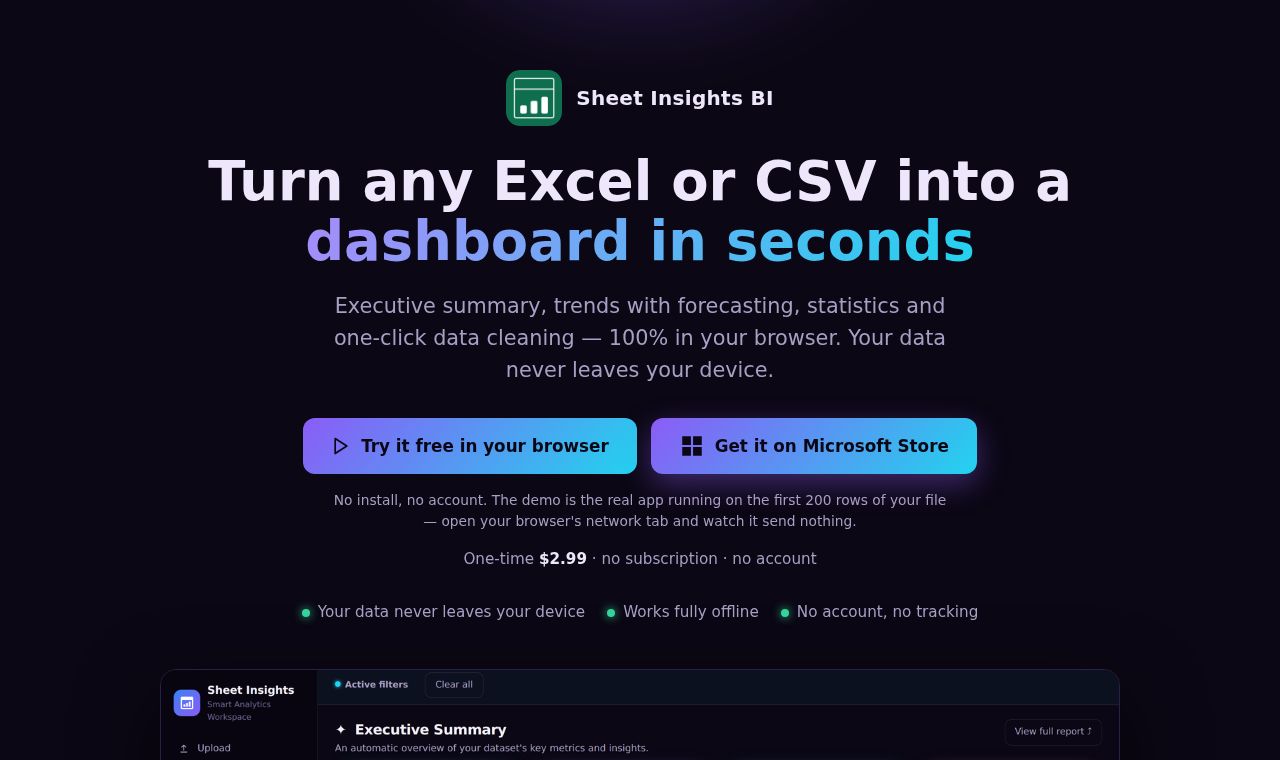 SITE CAPTURE
Based on information published on the service's website. Selection and review policy
WHAT IT DOES
What does it do?
Sheet Insights BI creates interactive reports with KPIs, statistics, trends, and forecasts from imported Excel or CSV files. Users can remove duplicates, clean whitespace, perform fuzzy merges, and fill missing values with reusable recipes. Processing takes place on the device without accounts, servers, or telemetry, and the installed Microsoft Store app runs without a connection.
KEY FEATURES
Key features
- Automatically create interactive reports from Excel and CSV files
- Display KPIs, gauges, and automatic highlights
- Show monthly, quarterly, and yearly trends and a hypothetical forecast simulator
- Show distribution, percentile, outlier, correlation, and Pareto statistics
- Remove duplicates, clean whitespace, perform fuzzy merges, and fill missing values
- Export to Excel, self-contained HTML dashboards, CSV, and JSON